Transmitting a message from one agent to another is not nearly as fast as one object invoking a method on another object within the same process. While the latter involves a few highly optimized processor instructions, the former necessitates a multitude of processor instructions in comparison.
However, the actor model doesn’t strive to compete at the level of single invocations. The traction for that paradigm has increased due to the contemporary need for massively parallel computing applications. Indeed, a key aspect of the actor model’s appeal lies in its capacity to express unbounded parallelism. Its emphasis on message passing, isolation of state, and decentralized control makes it suitable for developing concurrent applications by simplifying common challenges associated with multithreading.
As we have learnt, the actor model provides a high-level abstraction where actors – or agents – communicate through messages, allowing us to focus on the logic without dealing with low-level thread management nor with message delivery mechanics that are referred to the framework. Programs can be scaled by distributing agents across multiple threads, making this paradigm well-suited for applications with varying workloads. In the general actor model, the distribution can also happen across other processes and machines.
However, if the performance of our system falls short of the requirements, we simply want to prevent performance regressions over time, or we need to assess and fine-tune applications then we should extract and keep track of performance metrics.
An important premise to consider is that measuring and observing performance in software is challenging. Applications often run in diverse environments with varying hardware, operating systems, and configurations, making it difficult to establish standardized measurements. Additionally, external applications, either directly or indirectly, can have an impact, resulting in less deterministic tests and benchmarks.
This three-part full-immersion provides a friendly introduction to performance metrics and considerations in message-passing styled applications, with a specific emphasis on SObjectizer and the in-process actor model. Additionally, we will explore key factors that framework developers often benchmark for comparative analysis with other frameworks.
It’s essential to note we won’t address the broader subject of measuring software performance “in general” or when a system is distributed across multiple processes and machines.
Performance model
A well-known model to represent the performance characteristics of a single actor is presented in Akka in Action, applied here below to our face_detector:
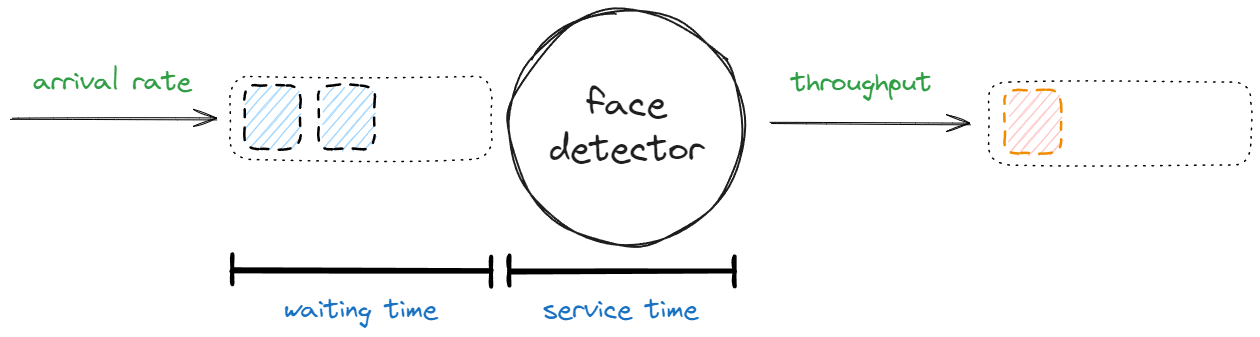
In essence, it consists of a few metrics:
- the arrival rate is the number of messages (e.g. images) to process during a period, usually expressed in a common time unit (e.g. 30 frames per second – 30 fps);
- the throughput is the number of processed messages during a period, usually expressed in a common time unit (e.g. 15 fps);
- the waiting time is the time one message spends in the queue before being handled (e.g. 1 microsecond);
- finally, the service time is the time needed to handle one message (e.g. the time needed by
face_detectorto recognize faces on a single frame).
While throughput is commonly linked to the “output of messages,” its significance extends beyond that and is applicable to “sink” agents that do not produce messages. For instance, the image_saver has a specific throughput, representing the number of images saved to disk per second, even though it does not generate outputs.
Frequently, the term “service time” is interchangeably used with another concept you might be more acquainted with: latency. To be precise, latency is equivalent to the sum of service time and waiting time. In simpler terms, it represents the duration it takes for a message to be processed from the moment it is sent to the agent’s queue to the moment it’s fully processed and, possibly, dispatched to another channel. It’s worth bringing into focus that in SObjectizer waiting time primarily depends on the dispatcher, whereas service time is determined by the agent.
Throughput and latency, much like jelly and peanut butter, go hand in hand and define the two primary categories of performance issues in such systems: either the throughput is too low, or the latency is too high. While boosting throughput can often be addressed through scaling, such as introducing more workers, addressing latency issues typically necessitates more fundamental changes, like adopting a different algorithm. Indeed, when dealing with a performance issue, tuning often involves a trade-off. To enhance the performance of an agent, we typically have three potential courses of action:
- increasing the number of workers to distribute work horizontally (e.g. using multiple instances of the same agent or executing agent’s handlers on multiple threads – as explained in the previous post);
- decreasing the arrival rate of messages to be processed;
- reducing the service time.
The most straightforward action, when feasible, is to increase the number of workers. This proves effective when throughput is a concern, and contending for CPU power does not adversely impact overall performance. The second strategy involves reducing the arrival rate, but this may not always be practical and might require altering the system’s design. In such scenarios, filtering can provide a potential help. The last approach is often challenging to implement and involves redesigning the functionality to decrease the time it takes for an agent to execute it.
Thus, the presented model, while straightforward, is sufficient for observing major issues during runtime. The optimal scenario occurs when arrival rate and throughput are nearly identical, indicating that the agent does not buffer, and the waiting time is minimal, approaching zero. On the flip side, if the throughput significantly lags behind the arrival rate, the agent will start buffering messages, introducing potential issues that were discussed when we delved into the realm of limiting message flow (another indicator of such problems is the agent’s queue size: when that number grows, it means that the actor is saturated).
So the first action we can take to monitor the system’s health consists in observing throughput.
Observing throughput
Often, throughput stands out as the pivotal metric, serving as a crucial indicator of the system’s sustainability from a load standpoint. Insufficient throughput prompts the need for further actions, such as investigating and optimizing service time, increasing the number of agents handling resource-intensive tasks, or even simplifying the system.
Although every performance-critical agent might be instrumented – even under specific configuration toggles – to provide performance metrics, introducing an agent that simply estimates the throughput on a certain channel over time might be useful. Imagine the following topology:
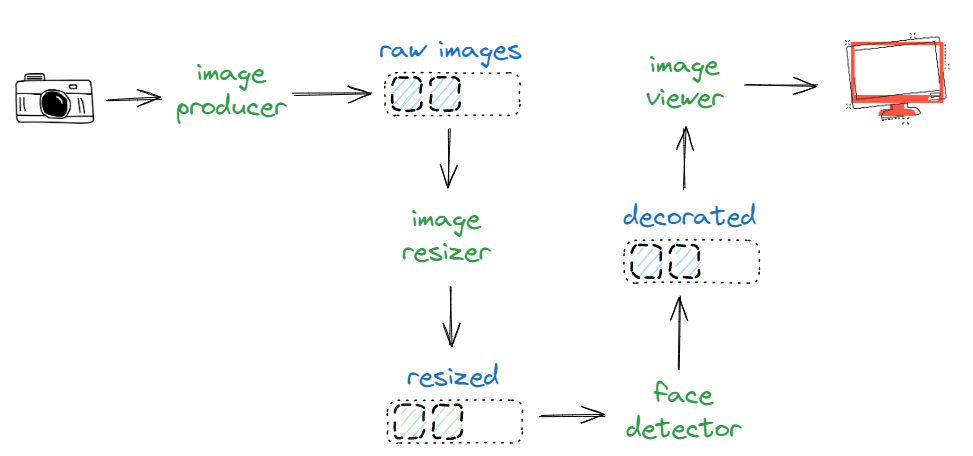
We introduce an “fps estimator” agent whose sole function is to estimate the number of frames transmitted to a specific channel over time:
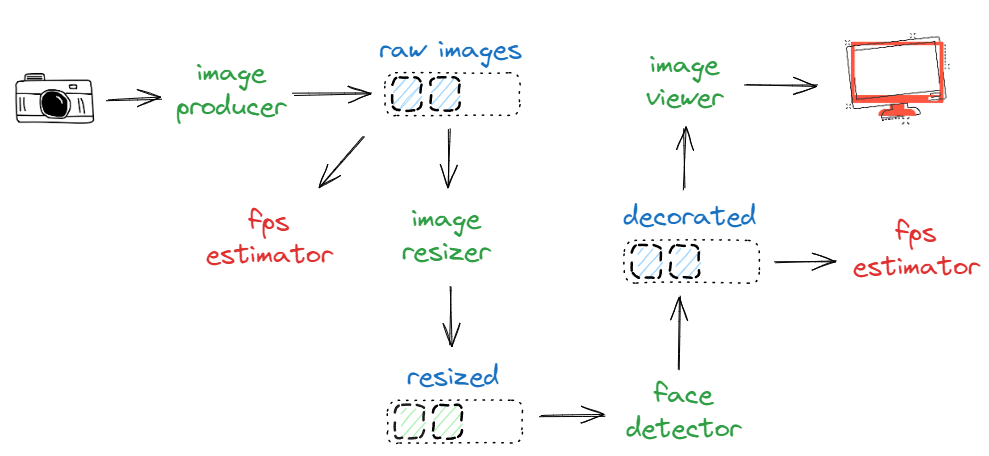
Above, we are simply estimating the throughput of image_producer (that is the arrival rate of image_resizer) and, ultimately, the throughput of the face_detector (that is the arrival rate of image_viewer). Ideally, there should be consistency in values of the initial and the second fps estimator. Conversely, if these values differ considerably, introducing additional estimators into the intermediate stages can help pinpoint and narrow down the source of the problem.
This approach resembles the process of measuring energy consumption at home with commercial “energy meters”:
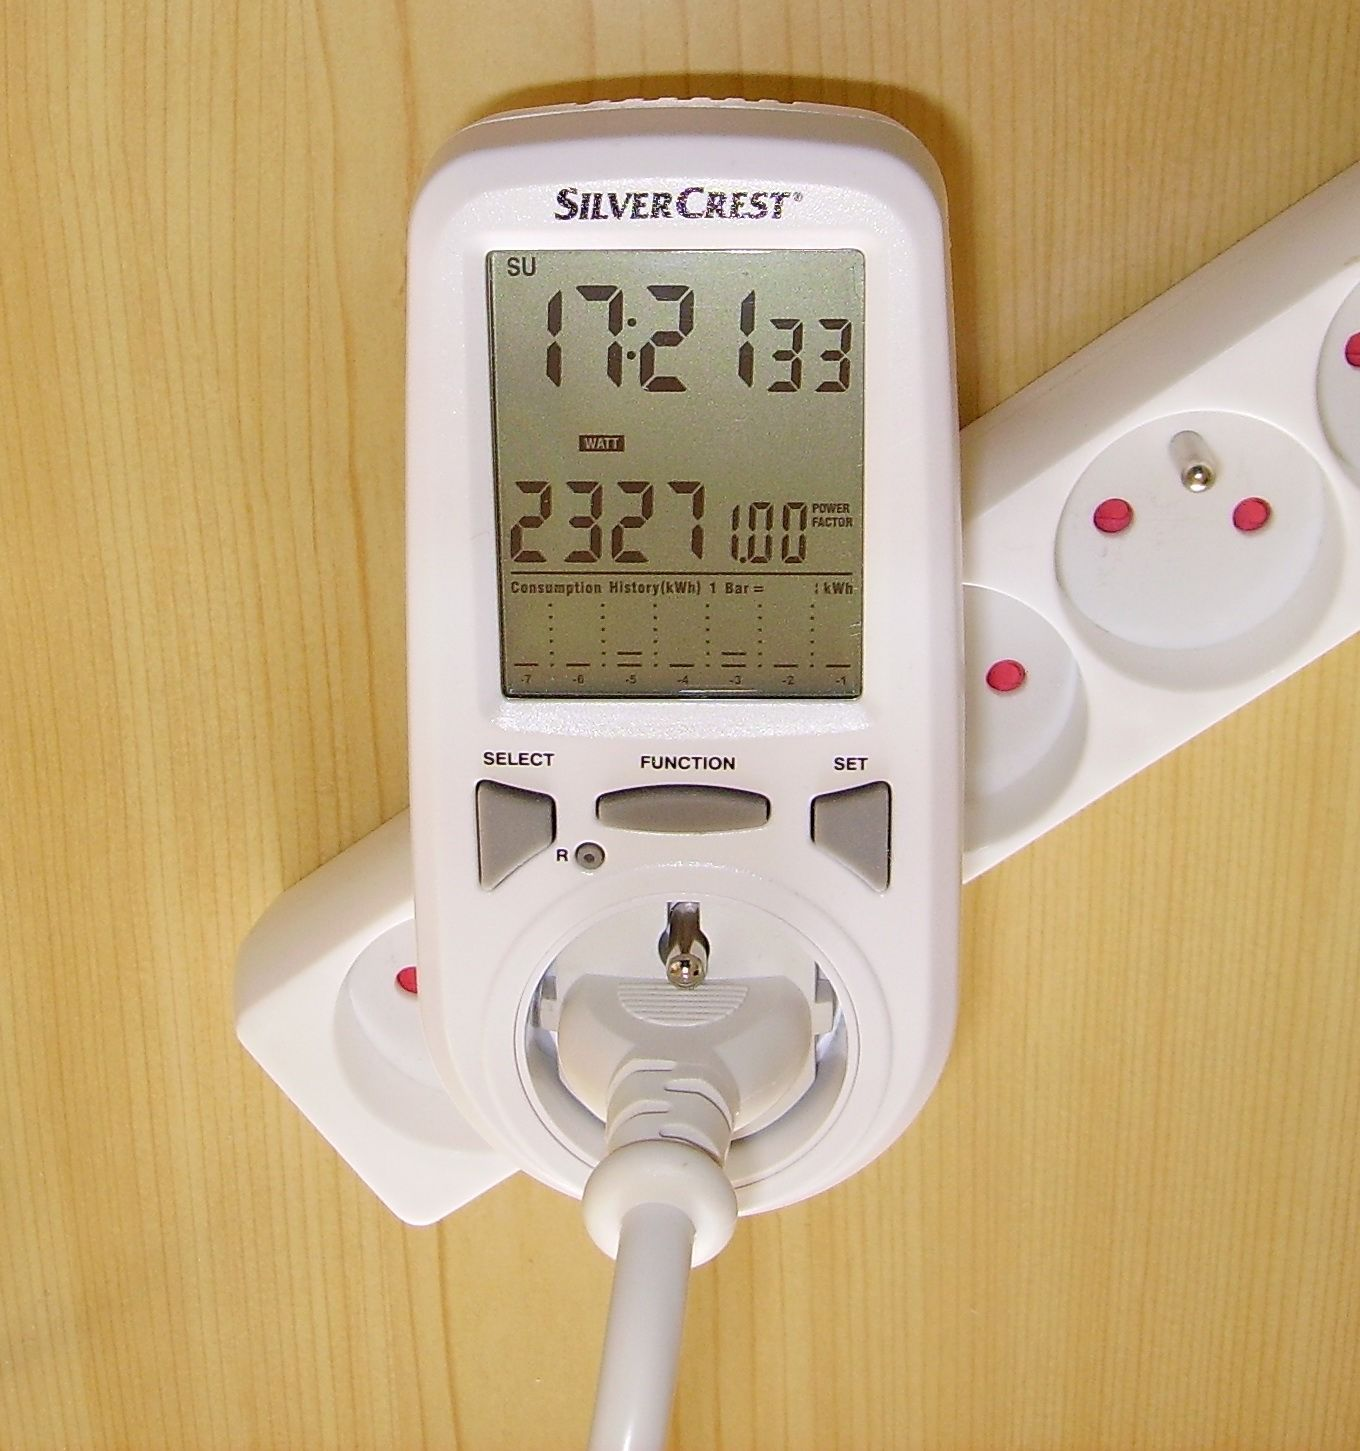
The sole semantic distinction lies in the fact that these devices function as “adapters,” rerouting “electricity” to the other side. Achieving a similar outcome could involve having the “fps estimator” redirect input images to an output channel. However, this is unnecessary since multiple agents can subscribe to the same channels — conversely, multiple devices can’t be connected to the very same electric socket.
The implementation of such estimator boils down to counting the number of frames received over a fixed time span and dividing such number by the elapsed time. This measure is performed and logged at regular intervals, such as 5 seconds but might vary statically or dynamically:
class fps_estimator final : public agent_t
{
	struct measure_fps final : signal_t {};
public:
	fps_estimator(agent_context_t ctx, mbox_t input)
		: agent_t(move(ctx)), m_input(move(input))
	{

	}

	void so_evt_start() override
	{
		m_timer = send_periodic<measure_fps>(so_direct_mbox(), 5s, 5s);
		m_start = chrono::steady_clock::now();
	}

	void so_define_agent() override
	{
		so_subscribe(m_input).event([this](const cv::Mat&) {
			++m_counter;
		});
		so_subscribe_self().event([this](mhood_t<measure_fps>) {
			const auto elapsed_time = chrono::duration<double>(chrono::steady_clock::now() - m_start);
			const auto fps = m_counter / elapsed_time.count();
			osyncstream(cout) << format("Estimated fps @{}=~{:.2f} ({} frames in ~{})\n", m_input->query_name(), fps, m_counter, chrono::round<chrono::seconds>(elapsed_time));
			m_start = chrono::steady_clock::now();
			m_counter = 0;
		});
	}

private:
	mbox_t m_input;
	timer_id_t m_timer;
	unsigned m_counter = 0;
	chrono::steady_clock::time_point m_start;
};
Let’s use this agent to measure the frame rate on both the main channel and the face detector’s output channel:
int main()
{
    const auto ctrl_c = get_ctrlc_token();

    const so_5::wrapped_env_t sobjectizer;
    const auto main_channel = sobjectizer.environment().create_mbox("main");
    const auto commands_channel = sobjectizer.environment().create_mbox("commands");
    const auto message_queue = create_mchain(sobjectizer.environment());

    sobjectizer.environment().introduce_coop(so_5::disp::active_obj::make_dispatcher(sobjectizer.environment()).binder(), [&](so_5::coop_t& c) {
        c.make_agent<image_producer_recursive>(main_channel, commands_channel);
        c.make_agent<maint_gui::remote_control>(commands_channel, message_queue);
		const auto resized = c.make_agent<image_resizer>(main_channel, 0.5)->output();
		const auto decorated = c.make_agent<face_detector>(resized)->output();

		c.make_agent<fps_estimator>(main_channel);
		c.make_agent<fps_estimator>(decorated);
    });

    do_gui_message_loop(ctrl_c, message_queue, sobjectizer.environment().create_mbox(constants::waitkey_channel_name));
}
A possible output follows:
Estimated fps @<mbox:type=MPMC:id=12>=~0.00 (0 frames in ~5s)
Estimated fps @main=~0.00 (0 frames in ~5s)
Estimated fps @<mbox:type=MPMC:id=12>=~15.00 (75 frames in ~5s)
Estimated fps @main=~15.00 (75 frames in ~5s)
Estimated fps @main=~20.41 (102 frames in ~5s)
Estimated fps @<mbox:type=MPMC:id=12>=~20.20 (101 frames in ~5s)
Estimated fps @main=~29.79 (149 frames in ~5s)
Estimated fps @<mbox:type=MPMC:id=12>=~30.00 (150 frames in ~5s)
Estimated fps @main=~29.80 (149 frames in ~5s)
Estimated fps @<mbox:type=MPMC:id=12>=~29.81 (149 frames in ~5s)
Estimated fps @main=~29.81 (149 frames in ~5s)
Estimated fps @<mbox:type=MPMC:id=12>=~29.81 (149 frames in ~5s)
Estimated fps @<mbox:type=MPMC:id=12>=~29.80 (149 frames in ~5s)
Estimated fps @main=~29.79 (149 frames in ~5s)
Estimated fps @main=~15.41 (77 frames in ~5s)
Estimated fps @<mbox:type=MPMC:id=12>=~15.40 (77 frames in ~5s)
Estimated fps @<mbox:type=MPMC:id=12>=~0.00 (0 frames in ~5s)
Estimated fps @main=~0.00 (0 frames in ~5s)
Estimated fps @<mbox:type=MPMC:id=12>=~0.00 (0 frames in ~5s)
Estimated fps @main=~0.00 (0 frames in ~5s)
When the stream is disabled, the frame rate is evidently zero. Upon initiating the acquisition, frames begin to flow, and the frame rate gradually increases until it stabilizes at a more constant value (around 30 in this example). The agent could be extended to measure the frame rate of multiple channels simultaneously, offering the advantage of obtaining more consistent results over time:
class fps_estimator final : public so_5::agent_t
{
	struct measure_fps final : so_5::signal_t {};
public:
	fps_estimator(so_5::agent_context_t ctx, std::vector<so_5::mbox_t> inputs)
		: agent_t(std::move(ctx)), m_inputs(std::move(inputs))
	{
	}

	void so_evt_start() override
	{
		m_timer = so_5::send_periodic<measure_fps>(so_direct_mbox(), 5s, 5s);
		m_start = std::chrono::steady_clock::now();
	}

	void so_define_agent() override
	{
		for (const auto& input : m_inputs)
		{
			m_counters[input->query_name()] = 0;
			so_subscribe(input).event([channel_name=input->query_name(), this](const cv::Mat&) {
				++m_counters[channel_name];
			});
		}

		so_subscribe_self().event([this](so_5::mhood_t<measure_fps>) {
			const auto elapsed_time = std::chrono::duration<double>(std::chrono::steady_clock::now() - m_start);
			for (auto& [id, counter] : m_counters)
			{
				const auto fps = counter / elapsed_time.count();
				std::osyncstream(std::cout) << std::format("Estimated fps @{}=~{:.2f} ({} frames in ~{})\n", id, fps, counter, std::chrono::round<std::chrono::seconds>(elapsed_time));
				counter = 0;
			}
			m_start = std::chrono::steady_clock::now();
		});
	}

private:

	std::vector<so_5::mbox_t> m_inputs;
	so_5::timer_id_t m_timer;
	std::map<std::string, unsigned> m_counters;
	std::chrono::steady_clock::time_point m_start;
};
Sometimes, it is beneficial to enable this log only during active streaming and not when the acquisition is inactive. In such cases, we can utilize states, as discussed in a previous post for stream_heartbeat:
class fps_estimator final : public agent_t
{
	struct measure_fps final : signal_t {};
public:
	fps_estimator(agent_context_t ctx, vector<mbox_t> inputs)
		: agent_t(move(ctx)), m_inputs(move(inputs))
	{
	}

	void so_define_agent() override
	{
		for (const auto& input : m_inputs)
		{
			st_handling_images.event(input, [channel_name = input->query_name(), this](const cv::Mat&) {
				++m_counters[channel_name];
				st_handling_images.time_limit(500ms, st_stream_down);
			});

			st_stream_down
				.transfer_to_state<cv::Mat>(input, st_handling_images);
		}

		st_handling_images.on_enter([this] {
			for (auto& counter : m_counters | views::values)
				counter = 0;
			m_timer = send_periodic<measure_fps>(so_direct_mbox(), 5s, 5s);
			m_start = chrono::steady_clock::now();
		})
		.on_exit([this] {
			m_timer.release();
		}).event([this](mhood_t<measure_fps>) {
			const auto elapsed_time = chrono::duration<double>(chrono::steady_clock::now() - m_start);
			m_start = chrono::steady_clock::now();
			for (auto& [id, counter] : m_counters)
			{
				const auto fps = counter / elapsed_time.count();
				osyncstream(cout) << format("Estimated fps @{}=~{:.2f} ({} frames in ~{})\n", id, fps, counter, chrono::round<chrono::seconds>(elapsed_time));
				counter = 0;
			}
		});

		st_stream_down.activate();
	}

private:

	state_t st_handling_images{ this };
	state_t st_stream_down{ this };
	vector<mbox_t> m_inputs;
	timer_id_t m_timer;
	map<string, unsigned> m_counters;
	chrono::steady_clock::time_point m_start;
};
Now, we can aggregate all the channels to monitor and pass them to a single instance of this agent:
c.make_agent<fps_estimator>(vector{main_channel, decorated});
This approach ensures a consistent measurement over the same time frame, and specifically, only when the stream is actively ongoing:
Estimated fps @<mbox:type=MPMC:id=12>=~30.00 (150 frames in ~5s)
Estimated fps @main=~29.99 (150 frames in ~5s)
Estimated fps @<mbox:type=MPMC:id=12>=~29.80 (149 frames in ~5s)
Estimated fps @main=~29.80 (149 frames in ~5s)
Estimated fps @<mbox:type=MPMC:id=12>=~29.79 (149 frames in ~5s)
Estimated fps @main=~29.79 (149 frames in ~5s)
While this serves as a rough indicator, it effectively fulfills its role in detecting major issues. Suppose a bug is introduced in the face_detector. The log might quickly reveal something unexpected:
Estimated fps @<mbox:type=MPMC:id=12>=~16.79 (84 frames in ~5s)
Estimated fps @main=~30.00 (150 frames in ~5s)
Estimated fps @<mbox:type=MPMC:id=12>=~17.40 (87 frames in ~5s)
Estimated fps @main=~29.80 (149 frames in ~5s)
Estimated fps @<mbox:type=MPMC:id=12>=~17.60 (88 frames in ~5s)
Estimated fps @main=~30.00 (150 frames in ~5s)
In this case, the two channels have different fps, revealing a slowdown somewhere in the pipeline. This might not be a critical issue, especially if the situation is temporary.
This rough measure lends itself well to integration into an automated test. Frequently, tests of this nature monitor performance trends rather than simply asserting on a singular basis. In essence, we can set up tests to measure the throughput of specific agents or pipelines, like the example above. These tests can then be executed on some selected build agents or dedicated machines – ensuring as much repeatability as possible – that store such metrics and provide access to them. Other scripts can subsequently calculate statistics on the resulting trend over time. This approach extends beyond throughput; it’s a more general technique applicable to many performance indicators that do not demand fine accuracy, conversely, for example, to micro-benchmarking, which needs more sophisticated approaches.
Likewise, it’s possible to create agents that perform such trend analysis in real-time while the system is operational, triggering alerts in the event of issues or unexpected behaviors.
Benchmarking the maximum throughput
fps_estimator and similar agents can be beneficial for checking and monitoring if an up and running system is behaving as expected. However, there are situations where we aim to determine the performance of an agent or a group of agents. For instance, we may want to estimate the maximum throughput of image_resizer, under some conditions.
This value can prove useful for various reasons, such as:
- assessing if a particular agent (or group) meets specific performance requirements;
- comparing the performance of different agents;
- evaluating the impact of using different dispatchers on a specific agent (or group);
- conducting benchmarks for specific hardware and platform combinations.
For instance, if the image_resizer
In contrast to the fps_estimator, where the measurement occurs in real-time on an actual or simulated system, in this case, we isolate the calculation within a test bench. The actual calculation closely resembles that performed by the fps_estimator, but in this instance, the quantity of messages to be ingested is predetermined and the system under test is more minimal and is run for a limited amount of time.
The test itself is quite versatile and can be applied for broader purposes beyond the maximum throughput calculation, so we’ll revisit this concept later in the series. First of all, we introduce this support function object:
template<typename Message>
class frequency_calculator
{
public:
	frequency_calculator(unsigned messages_count, mchain_t output)
		: m_messages_count(messages_count), m_output(move(output))
	{
	}

	double operator()() const
	{
		chrono::steady_clock::time_point tic;
		receive(from(m_output).handle_n(1), [&](mhood_t<Message>) { // first message
			tic = chrono::steady_clock::now();
		});

		receive(from(m_output).handle_n(m_messages_count - 2), [&](mhood_t<Message>) {});

		double frequency;
		receive(from(m_output).handle_n(1), [&](mhood_t<Message>) { // last message
			frequency = m_messages_count / chrono::duration<double>(chrono::steady_clock::now() - tic).count();
		});
		return frequency;
	}
private:
	unsigned m_messages_count;
	mchain_t m_output;
};
This class is designed to measure the time it takes to receive a specified number of messages (or signals – here you can see the power of mhood_t in action) on a particular channel. Similar to the fps_estimator, the frequency is determined by dividing the number of messages by the elapsed time. The calculation involves three receiving stages:
- when the first message is received, we record the start time;
- in the middle stage, we consume all the messages except the last one;
- lastly, upon receiving the last expected message, we calculate the frequency.
On the testing side, the setup involves configuring the agents to benchmark. The frequency_calculator can be encapsulated into an async operation. For example:
TEST(performance_tests, image_resizer_maximum_throughput)
{
	constexpr unsigned messages_count = 100;

	wrapped_env_t sobjectizer;
	auto& env = sobjectizer.environment();

	auto input_channel = env.create_mbox();
	const auto output_channel = create_mchain(env);

	env.introduce_coop([&](coop_t& coop) {
		coop.make_agent<image_resizer>(input_channel, output_channel->as_mbox(), 4.0);
	});

	auto throughput = async(std::launch::async, frequency_calculator<cv::Mat>{messages_count, output_channel});

	const auto test_frame = cv::imread("test_data/replay/1.jpg");
	for (auto i = 0u; i<messages_count; ++i)
	{
		send<cv::Mat>(input_channel, test_frame);
	}

	cout << format("image_resizer maximum throughput measured on {} frames = {:.2f} fps\n", messages_count, throughput.get());
}
Typically, such tests are not executed only once but multiple times, with the average value being taken as the reference measure. On my machine (Intel i7-11850H @2.50GHz, 8 Cores), the average result from running this test a hundred times is approximately 900 fps.
As mentioned, this test serves as an estimation of the maximum throughput and is not intended as a precise measure, given that the asynchronous operation is not perfectly synchronized with the sending of the images. More sophisticated approaches can be explored for a more accurate assessment. Also, consider these numbers are currently taken on the test image only. To provide a more comprehensive evaluation, a broader range of frame sizes and contents should be considered.
At this point, a possible experiment involves assessing if running image_resizer on multiple threads gives any advantage, since its operation appears to be configurable as thread-safe:
class image_resizer final : public so_5::agent_t
{
public:
	// ... as before

	void so_define_agent() override
	{
		so_subscribe(m_input).event([this](const cv::Mat& image) {
			cv::Mat resized;
			resize(image, resized, {}, m_factor, m_factor);
			so_5::send<cv::Mat>(m_output, std::move(resized));
		}, so_5::thread_safe);
	}

	// ... as before
private:
	// ... as before
};
To run this experiment, we just need to implement this change and use the adv_thread_pool dispatcher, as learnt in the previous post:
// ... as before
auto pool = so_5::disp::adv_thread_pool::make_dispatcher(sobjectizer.environment(), 2).binder(so_5::disp::adv_thread_pool::bind_params_t{}.fifo(so_5::disp::adv_thread_pool::fifo_t::individual));

env.introduce_coop(pool, [&](coop_t& coop) {
	coop.make_agent<image_resizer>(input_channel, output_channel->as_mbox(), 4.0);
});
// ... as before
The results are not impressive, as the throughput of the multi-threaded version is slightly worse than the single-threaded one (around 850 fps). Why is this the case? Further investigation reveals that cv::resize already utilizes multiple threads internally so increasing the contention on the CPU makes things even worse.
A similar single-threaded calculation might be set up for the face_detector:
TEST(performance_tests, face_detector_maximum_throughput)
{
	constexpr unsigned messages_count = 100;

	wrapped_env_t sobjectizer;
	auto& env = sobjectizer.environment();

	auto input_channel = env.create_mbox();
	const auto output_channel = create_mchain(env);

	env.introduce_coop([&](coop_t& coop) {
		coop.make_agent<face_detector>(input_channel, output_channel->as_mbox());
	});

	auto throughput = async(std::launch::async, frequency_calculator<cv::Mat>{messages_count, output_channel});

	const auto test_frame = cv::imread("test_data/replay/1.jpg");
	for (auto i = 0u; i<messages_count; ++i)
	{
		send<cv::Mat>(input_channel, test_frame);
	}

	cout << format("face_detector maximum throughput measured on {} frames = {:.2f} fps\n", messages_count, throughput.get());
}
On my machine, launching this test several times gives, on average, 90 fps.
This approach is primarily effective when observing a channel that is the output of an agent. In essence, if the test is well-isolated, the frames per second (fps) on such a channel will closely align with the throughput of the agent. It’s worth noting that, for even more strict accuracy, the call operator of the frequency_calculator should be synchronized with the sending of data. However, this synchronization overhead is negligible when the cost of each agent’s call is significant.
Takeaway
In this episode we have learned:
- performance of actor-based systems are generally characterized by throughput and latency;
- throughput is the number of processed messages during a period, usually expressed in a common time unit (e.g. 15 fps);
- latency is the duration it takes for a message to be processed from the moment it is sent to the agent’s queue to the moment it’s fully processed;
- often, throughput problems are firstly addressed by trying to distribute work (scaling), or by reducing the flow of messages to be processed;
- latency is usually more difficult to optimize as it needs further work into the internals of the agents or the design of the system itself;
- estimating throughput over time might be convenient to observe if the system is sustainable from a load standpoint;
- determining maximum throughput of agents or groups of agents can be done using more isolated tests.
As usual, calico is updated and tagged.
What’s next?
In the next article, our discussion with Helen on performance continues, shifting our focus to another crucial metric within our control: service time.
Thanks to Yauheni Akhotnikau for having reviewed this post.
